Alzheimer's Classification
Classification through Handwriting Analysis
Authors: Frederik Hartmann, Agustin Cartaya, Jesus Gonzalez, Micaela Rivas
Code: Github
This project was carried out within the scope of the Machine and Deep Learning course taught by Prof. Dr. Alessandra Scotto di Freca . You can reach a detailed report here.
June 2023
Dataset
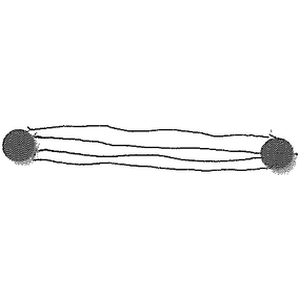
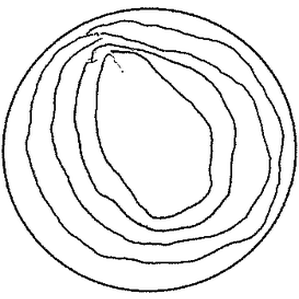
The dataset consists of 166 observations from Alzheimer’s patients (n = 88) and healthy controls (n = 78), with 92 features per task, including patient demographics and health status. The participants perform 25 tasks in three groups (memory, copy/reverse copy, and graphic) using a graphic tablet to record pen movements. Both the pen features and the images are stored. The pen features are differentiated into in-air and on-paper. The pen features consist of features such as “mean velocity on paper” or “standard deviation of straightness error in the air”. For this project, a subset of six tasks was used to classify Alzheimer’s disease.


Analyzing the pen features with Machine Learning
In order to classify Alzheimer’s disease, a fully automatic pipeline has been built. First, three different feature selection approaches have been performed. Second, an exhaustive search of different outlier detection techniques, feature scalers, and classifiers has been employed. Based on the cross-validation results (n = 5), the best pipeline for each classifier was chosen. Third, the hyperparameters of each classifier pipeline were tuned individually. This process was repeated for each task.
Analyzing the images with Deep Learning
For the classification based on the images, a transfer learning approach has been chosen. All backbone models were trained on ImageNet.
- VGG19
- ResNET50
- InceptionV3
- InceptionResnetV2
For each of the backbone models, four different heads have been tested.
- GlobalAveragePooling2D layer, followed by a 200-dense layer with ReLU as the activation function, and one final 2-dense layer classifier based on sigmoid activation function.
- GlobalAveragePooling2D layer followed by a 256-dense layer with ReLU acti- vation function, then a 128-dense layer again with ReLU activation function, then a 64-dense layer with the ReLU activation function, and finally a 2-dense classifier layer using sigmoid as activation.
- GlobalAveragePooling2D layer, followed by a 256-dense layer with ReLU activation function, then a 0.5-dropout layer, and then a 2-dense classifier. layer with the Softmax activation function.
- Feature Extraction with Backbone Model. Classification with Machine Learning

For each of the different heads, multiple variants of unfrozen and frozen layers were tested.
Results
In the following, an example of the results is shown. For more detailed results, refer to the report.
| In Air | On Paper | All dataset | |||||||
|---|---|---|---|---|---|---|---|---|---|
| Task | Full | RF10 | RF400 | Full | RF10 | RF400 | Full | RF10 | RF400 |
| 1 | 69.8 | 69.9 | 72.9 | 73.5 | 73.5 | 75.3 | 71.7 | 74.7 | 71.6 |
| 2 | 72.3 | 74.1 | 72.3 | 68.6 | 71.0 | 71.7 | 71.1 | 74.7 | 72.3 |
| 3 | 70.5 | 66.9 | 71.7 | 72.2 | 74.0 | 74.1 | 71.1 | 69.8 | 70.4 |
| 4 | 68.1 | 66.3 | 67.4 | 70.5 | 71.1 | 71.1 | 71.8 | 69.3 | 71.7 |
| 9 | 63.2 | 69.2 | 68.0 | 68.7 | 68.7 | 72.9 | 66.2 | 67.4 | 69.2 |
| 10 | 68.0 | 66.2 | 74.1 | 71.7 | 69.8 | 71.0 | 70.4 | 67.5 | 73.5 |
| Model | Optimizer | Unfrozen layers | Acc | AUC |
|---|---|---|---|---|
| VGG19 | Adam | 2 | 84.0 | 0.89 |
| resnet50 | Adam | 3 | 68.0 | 0.84 |
| ir2 | SGD | 3 | 74.0 | 0.82 |
| inceptionv3 | SGD | 0 | 74.0 | 0.81 |
| Classifier | RFT | DTC | SVM | XGB | MLP |
|---|---|---|---|---|---|
| Accuracy | 0.8 | 0.8 | 0.84 | 0.82 | 0.76 |
| F1-Score | 0.814 | 0.799 | 0.84 | 0.823 | 0.799 |
| Precision | 0.814 | 0.869 | 0.913 | 0.875 | 0.727 |
| Recall | 0.814 | 0.740 | 0.777 | 0.777 | 0.888 |
Conclusion
In the project, Task 1 proved challenging for comparison due to the unique nature of each sample. Writing dynamics analysis was more effective than image analysis using deep learning for this task. Signature tasks, which rely on memory, showed that learned motor patterns impact performance. For other copy tasks and graphic tasks, deep learning methods yielded better results. The study highlighted the importance of choosing the right classifier based on the task, with dynamic features suiting unique form copy tasks and deep learning features excelling in graphic and general copy tasks.